Welcome to the Home of SPSS 24 Help! Have a question? Email me at mbriscoe@masonlive.gmu.edu. This page has:
- Information about SPSS Data view.
- Information about SPSS Variable view.
- SPSS definitions
- Key SPSS skills for common research questions.
- Practice questions for midterm definitions.
Data View
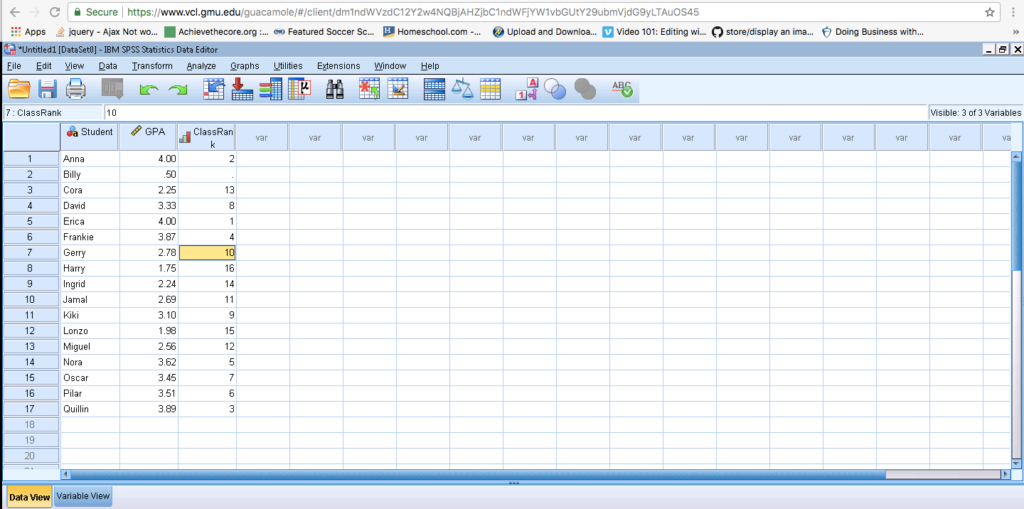
The Data View is most comfortable. It is the view that looks like Microsoft Excel, and holds all your data values. Please be sure to check the bottom tab often to make sure you are on the screen that is right for your task.
In this example, you can see the column headings that this dataset has 3 variables: Student, GPA, and Class Rank. You can also see that there are symbols beside each variable. Student shows a Venn Diagram because the data is nominal. The GPA shows a ruler to remind you that is a scale. Class rank shows a bar graph of increasing size to remind you that ordinal data is ranked.
Quick Checks on the Data View:
- How many pieces of data are in this set?
- Which row has a missing piece of data?
- Can you explain why the names are nominal data?
- Can you explain why the GPA data are scale data?
- Can you explain why the Class Rank data are ordinal data?
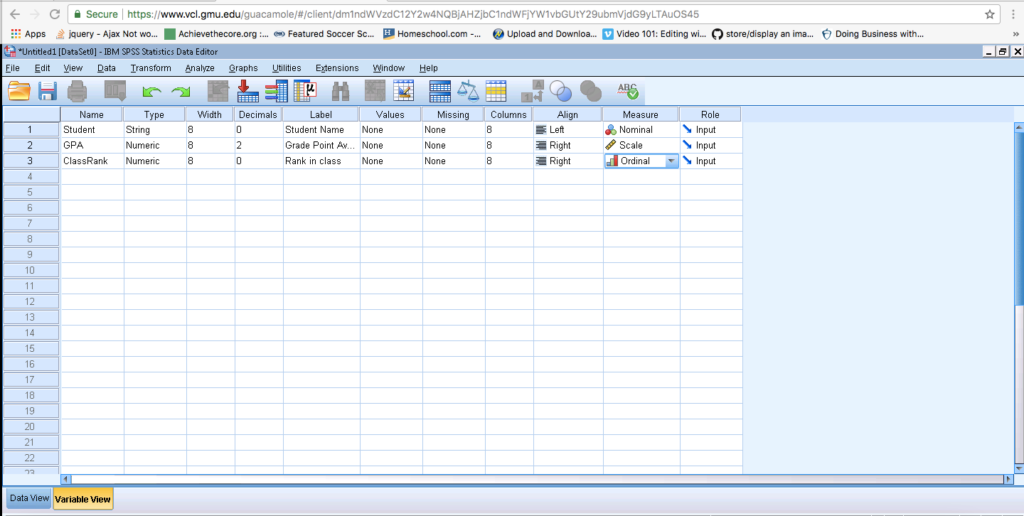
Variable View
This view makes SPSS more powerful than ExcelTM. You use this view to structure the dataset so SPSS knows how to work with it.
Use these links to further explore each aspect of defining a variable.
| Name | Type | Width | Decimals | Label | Missing | Columns | Align | Measure | Role |
Name
This value appears at the top of the columns in the Data View. You cannot put spaces in this field.
I tend to use “camel case”, which means capitalize the second, third, fourth, etc. word (e.g., “camelCase”).
Type
There are two types of variables numbers and words. For example, GPA is a number (e.g., 3.55), while Class Rank is a word (e.g., “Sophomore”).
Width
The default setting is 8. This states how many characters can be in the data values.
Decimal
This setting determines the number of digits after the decimal point. Take these examples with the number “5”.
If “Decimal” is 2 → 5.00
If “Decimal” is 1 → 5.0
If “Decimal” is 0 → 5.
If “Decimal” is 4 → 5.0000
Label
This value appears in the Output. You can use spaces here. Use anything that will help make the output more meaningful.
Values
You can use “Values” to set values for categorical data, like gender.
For example, we can show gender as a string variable by tagging 0=male and 1=female. First, click the button that appears on the right side of the cell. The pop-up window will give you a place to enter the value (e.g., “0”) and the label (e.g., “Male”). Then, the variable will be coded in the data view. Be careful, this is case sensitive.
Missing
You will not need this field for our analyses. It allows you to enter rules SPSS can do to fill in the gaps of datasets with missing data.
Columns
You will not need to adjust this field for our analyses. It determines the width of the data fields.
Align
This attribute is just like a word processor. Left align data is aligned on the left side of the cell. Right align data is aligned on the right side of the cell.
Measure
THIS IS AN IMPORTANT ONE TO CHECK! There are three different types of measures in SPSS.
Nominal: Categorical (e.g., gender, class period) or descriptive (e.g., name) data
Ordinal: Anything that can be ranked (e.g., class rank).
Scale: Includes ratio (e.g., temperature) and interval (e.g., test scores) data.
Role
You do not need to adjust this setting. It should be set on “Input.”
Key Skills for SPSS
Finding the mean
Analyze → Descriptive Statistics → Descriptives, Select measures by clicking “Options”. Then, click OK.
Research Questions:
What is the average score of this year’s SAT takers?
Running frequencies
Analyze → Descriptive Statistics → Frequencies, Select measures of center by clicking “Options”. Then, click OK.
Research Questions:
How many of the data are equal to 100?
How many of the data are between 100 and 200?
Creating Graphs
Graphs → Legacy Dialogs
Research Questions:
What are the values of the data?
Calculating a new variable
Transform → Compute Variable
If you are re-calculating a column, put the variable name in TargetVariable.
If you are calculating a new column, type the new variable name in TargetVariable.
Research Questions:
How many hours are these 50-minute class periods?
Comparing means of data
First. Split the dataset by going to Data → Split Cases. Click the third option, “Organize output by groups”, then move the variable over that you are using to divide the sample.
Second. Calculate the statistics by going to Analyze → Descriptive Statistics → Frequencies. Select the measures you are interested in comparing
Research Questions:
Which intervention resulted in higher test scores?
Note: When you are ready to turn off “split file” you click “analyze all cases, do not create group.” As you see the groups part will be shaded and therefore the split file command is turned off.
Research Questions:
Vocabulary Questions for Midterm Practice
[otw_shortcode_button href=”https://www.myedme.com/login/?p=12713″ size=”large” icon_type=”general foundicon-right-arrow” icon_position=”right” shape=”square”]All 40 vocabulary questions [/otw_shortcode_button]
| [otw_shortcode_button href=”https://www.myedme.com/login/?p=12729″ size=”large” icon_type=”general foundicon-right-arrow” icon_position=”right” shape=”square”]Midterm Practice 1 (10 questions) [/otw_shortcode_button] [otw_shortcode_button href=”https://www.myedme.com/login/?p=12744″ size=”large” icon_type=”general foundicon-right-arrow” icon_position=”right” shape=”square”]Midterm Practice 2 (10 questions) [/otw_shortcode_button] [otw_shortcode_button href=”https://www.myedme.com/login/?p=12757″ size=”large” icon_type=”general foundicon-right-arrow” icon_position=”right” shape=”square”]Midterm Practice 3 (10 questions) [/otw_shortcode_button] [otw_shortcode_button href=”https://www.myedme.com/login/?p=12772″ size=”large” icon_type=”general foundicon-right-arrow” icon_position=”right” shape=”square”]Midterm Practice 4 (10 questions) [/otw_shortcode_button] |
[otw_shortcode_button href=”https://www.myedme.com/login/?p=12794″ size=”large” icon_type=”general foundicon-right-arrow” icon_position=”right” shape=”square”]Midterm Review 1 (20 questions) [/otw_shortcode_button] [otw_shortcode_button href=”https://www.myedme.com/login/?p=12816″ size=”large” icon_type=”general foundicon-right-arrow” icon_position=”right” shape=”square”]Midterm Review 2 (20 questions) [/otw_shortcode_button] |
| [otw_shortcode_button href=”https://www.myedme.com/login/?p=12857″ size=”large” icon_type=”general foundicon-right-arrow” icon_position=”right” shape=”square”]Hypothesis Testing (Set 1) [/otw_shortcode_button] | [otw_shortcode_button href=”https://www.myedme.com/login/?p=12874″ size=”large” icon_type=”general foundicon-right-arrow” icon_position=”right” shape=”square”]Hypothesis Testing (Set 2) [/otw_shortcode_button] |
| [otw_shortcode_button href=”https://www.myedme.com/login/?p=12883″ size=”large” icon_type=”general foundicon-right-arrow” icon_position=”right” shape=”square”]Normal Distribution Percentages (Set 1) [/otw_shortcode_button] | [otw_shortcode_button href=”https://www.myedme.com/login/?p=12897″ size=”large” icon_type=”general foundicon-right-arrow” icon_position=”right” shape=”square”]Normal Distribution Percentages (Set 2) [/otw_shortcode_button] |